
SynAir-G has reached an important milestone within WP6, the work package leading on the data and intelligence engine, with the launch of the internal Data Explorer Dashboard. The dashboard provides project partners and internal stakeholders with a comprehensive overview of the project’s data, including its status, format, and accessibility.
Launched earlier this month, the Data Explorer Dashboard integrates data from all SynAir-G data sources and transforms it into an easily readable format for both researchers and AI systems responsible for modelling activities. The dashboard operates in real time, ensuring users always have access to the latest multimodal data generated throughout the project.
The platform offers several functionalities, including:
- Information on data availability and measurement levels, supported by analytics tools (Figure 1)
- Complete mapping of devices and software, including their location and operational status
- Insights into the temporal resolution of the data (Figure 2)
- Identification of time overlaps between measurements from different data sources
- Data navigation and download capabilities across any selected date range since the start of the project
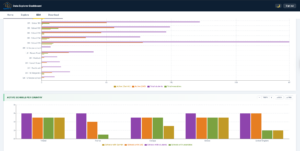
Figure 1. Data Explorer Dashboard: Analytics and Data Exploration.
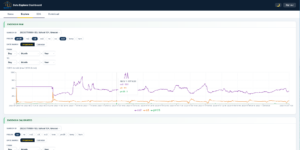
Figure 2. Data Explorer Dashboard: Sensorial data over time
In parallel, a second dashboard is currently under development. This platform will provide real-time insights into the concentration of environmental factors and pollutants in classrooms, further supporting SynAir-G’s work on indoor air quality and children’s health.
Stay connected! Follow SynAir-G on Twitter and LinkedIn, and subscribe to the SynAir-G Newsletter to receive latest updates.